


Contact Information
The excel take home final is ready for you. Click on this link to bring down this test. It is 3 excel problems and you are being told how to do them. The first is by the new construct table, the second is by pivot table and subtotals (do not put this into the new construct), and the third is your choice as long as you can do pivot table analysis.
To get the book at this late date:I think you are going to need to use Paradigm customer service. Call 1-800-535-6865.
Choose the option for paradign or EMCP. Tell the representative you are after isbn:978-0-76383-705-1
Book name is Applied Computer technology, Authors are the Sisters Rutkowsky
Additional components are 180 trial copy of Office 2007
and a package describing the snap2007 website with a password on the inside cover
Price is 69.95, delivery is 10 in 3 business days
Let's discuss this file and what it entails. Obviously it already exists and is saved in the previous version of word using the doc format. Below this are some things we'd like to discuss.
Important Note:
I have established this course on the paradigm web site. You will need to enroll yourself on this. Use this link to get to there snap2007.emcp.comUsing the password within the front cover of your book, enter the site and register for my course which I have indicated as Marc Rauer's course. The code necessary to register is churning-lacrosse. I have already selected a series of tutorials for you which will be active for the duration of the course. Note: Once you are on the paradigm site, you will be asked to load an add-in for streaming internet data. Answer yes to this and you may need to manipulate your security to allow this add-in on your system. Further, the site runs only on IE6 and IE7. For compatibility to IE8,click this link. It will not run on Firefox
We did not finish our discussion of the Thorne Smith document on the 15th. Let's finish it today. We want to look at the following:
Try the Harry Kalas document tutorial below at home!
In the prior exercise, we edited an already exisiting document. What about a new document? What issues do we face on this? Chapter 1 in your book tries to answer this and you should read this chapter. At the end of the chapter are some problems, designated as assessments. The first assessment, to recreate figure 1-7, we will do in class
Some of the things to look at while we do this
The first half of today's lecture will deal with the creation of documents as referenced above in the book. So, see above for the documentation of the problem and you can try a document yourslf this weekend using the institute of historical awareness document in additional resources below.
Second half today begins our study of objects insert into a document. This includes the following objects:
Note: We have already looked at cover pages and have a little experience with pictures.
And, a further note: There is quite of bit of addiitonal capacity for graphics in the docx format. If you remain in the doc format, much will be hidden
Our study of graphic objects (and other objects) will start with the catacomb.doc document which you can down load by clicking here. We are going to recreate this in class. We also need the picture,
As to the creation of a quick parts header, see the tutorial on this type of creation by clicking here to pull up the catacomb.htm web tutorial
Now, let's continue with the catacombs' problem, but there is a table to be created in this document. So, let's first study the word table tutorial that your insturctor has used in previous years.
But first, what is a table. Tables come out of mathematics. It is an attempt to govern the nature of two dimentional data representation. Mathematicians went back to the Greek and Roman architectural principals in dealing with the components. Verically, we have columns. Horizonally, we deal with rows. THe intersection of a row and a column is called a unit, cell or element. In data processing, we use the term cell. A cell's location is unique. Those dealing with cells generally designate them as row and column although Microsoft has been known to reverse this. Now, in studying tables, keep in mind that in word, these tables and cells are surrounded by text and the table is dealt in Word as if it's a big word. It moves in line with the preceding text. When we start to study Excel next week, we will see the Excel is only cells and there is no text to worry about outside of the cells.
At home when going over what we did in class in terms of tables, use the document indicated in Additonal resources which is a word document (you will bring that down onto your system. In class, we'll use the following link to study this tutorial on tables
So, with the study of tables, we have everything to complete the catacombs project. Either your instructor will supply a word document that contains the header complete in week 4, or you may suply your own. Click off the header as the rest of the document (except for the coupon) is done within the word buffer.
Your instructor has added a date to start our project off. Use of dates in the PC are functions of the operating system. Using the insert menu, click Date and time. You have quite a few options as far as date format, and you should understand that your options are dependent on the society to which you have registered your system. In addition, you have the ability to update the date using 'update automatically'. This will substitite any future date that you utilize this doucment.
Next we fill in what is called an address. It's a simple concept which can become involved when dealing with mail merge addresses. Luckily we are not doing that. The address consists of 3 paragraphs. Let's put it and deal with spacing.
As you aware, your instructor has indicated a change in the default font used in Word. This has also been the cause of changes in spacing within and between paragraphs. Look at the address in dicated below
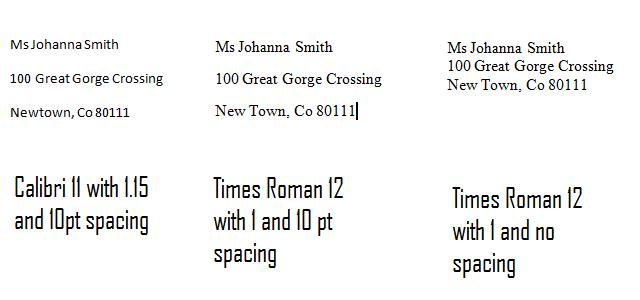
The first address is in Calabri with all the defaults. The next is in Times Roman 12 and a 1 designating spacing between lines. Notice that total height is about the same as to the left. The third set wipes out the 10 pts that each of the other two is adding to the paragraph as it moves to the next paragraph. The default in previous versions of Word for this type of spacing between paragraphs was 0 pts, in this version is it 10 pts. You can turn this off as your instructor will show you.
Anyway, the next challenge is the border and shading of a paragraph as indicated below

Theoreticaly this could be done by either a text box or paragraph. Paragraphs have built in properties that include even more than spacing or margin. In Word, each paragraph can be bulleted or numbered, justified, bordered or shaded. Use the bottom right icon in the paragraph section to bring up a quick style menu. You can see here thatborders of all type can be initiated. In our case, the old way of previous version of Word is the better, so click on borders and shading. You will see the borders and shading tabbed dialog box as indicated below.
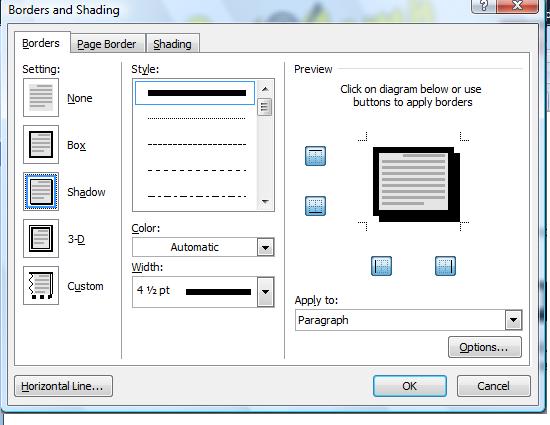
You have many options here and you should play with this on your own after the class. The first option is he type of border. Notice shadow. This option gives you an addiitonal amount of weight on the right and bottom border imitating depth. Additionally, you can choose the type of border and the weight of that border. In this case, the first style option, the unbroken line, coupled with a width of 4.5 will give the effect we want.
Let's look at shading by hitting the shading tab. Gear this for your audience. As we age, text intermingled with dark colors become less discernable. For older individuals, 10 to 15% shading should be the max. Younger individuals can discern greater mixtures of shading. For color, choose gray and you can decide what % shading should be initiated.
Another question that should arise: Why do this. In this example, this is being forced but this is a texhnique using the physiology of our eyes which are attracted to darkness surrounded by light. Indenting and adding spacing above and below a highlighted paragraph such as this is a guarantee that your reader's eyes will be attracted.
After this paragraph, the next big Word event is the table. This is a 5 row, 3 column table with the first row being a header. Using hte insert ribbon, select table and select the blocks needed to make a 5 by 3 table and click. In excel, the use of tables will be indicative of mathematics and logic. Generally, in Ms WOrd, use of tabes pertain to layout as in this problem. Now, fill in the table as indicated in the document. As indicated previously, movement is by tab key or mouse cursor. The table ribbons have appeared and these can be used to modify the table structure or deal with formating.
Once done, look at the design ribbon. Choose a table style (in previous versions of word this was called a format). Whatever you choose, this can augmented by the left most commands that include header and totals. In this case, we only have a header to worry about which oyu should click. In doing so, you are emphasizing the first row.
As mentioned before, you run into tables everywhere in data processing. I am at the moment in the process of programming similar structures in Visual Basic for my annual summer recycling project. The internet is full of tables. Until a technology designated as CSS became available in more modern browsers, tables wre what was used for most formatting. But invoking tables on the internet is quite different than in word - in fact much harder to control and to utilize. An example of formatting tables can be found in the this link where the web developer uses programming and merged files to get his effect.
A little further down we need to add the picture of Selina Kyle to our document. This has been greatly upgraded in this version of Word. Start with the insert ribbon, picture and select a picture. Pictures in Word are files of a certain type - pcx, bmp, gif,jpg,pnp, etc. These files in some way indicate pixel changes. We can use your instructor's qshared location to find an appropriate picture.
Once the picture is set in, notice the text run above and below. The picture tools format rinbbon is available and you can use text wrapping ot resolve this. Generally, our instructor selects tight. Notice the other options that we are going to try with this picture. Some of these options are new to this version of word.
ook at picture style. Similar to the preview we saw in the home ribbon, you can preview these possibilities. another new feature is position which will move your picture around the page. Note: posiiton automatically evokes tight as a text wrap option and this could have been used immediately assuming the positioning of the picture was applicable. Depending on your screen characteristics, you will see an option designated as picture effects or you will see the specific effects of shadow, reflction, glow and 3D rotation. Let's try a few of these in class and it is easier to show this then describe this in print
Once we have spent some time with pictures, the final thing is the textbox indicating a coupon. The way to andle this is the border which is dotted. Otherwise, this is just a regular textbox with a brownish fill
when we are done, you might want to try an addiitonal tutorial, the CCP instructor of the year, indicated below
Today, we should be wrapping up our study of MS Word. This version of Word is chock full of features and it is impossible to go over everything it contains in a survey course. As we move to other subjects, you may still want to practice learning new features of this application. One location on the Internet to expand your knowledge is http://office.microsoft.com/en-us/word/FX100649251033.aspx which is the product information location for Word on the Microsoft web site.
For our class today, we want to study several subjects that we omitted from previous lectures and then look at the question of using Word for academic papers.
So, additional features to discuss are
Now, after this, we end our study of Word with a look at using Word for Academic papers. For this, we are going to discuss
To do this, we are going to use the if.docx word document. This consists of 3 Internet pieces, the first by Keay Davidson of the San Francisco Examiner, the second by Andrew Lycett who has written a biography of Ian Fleming, "Ian Fleming - The Man Behind James Bond", and a review of this book by Tony Buchsbaum, a freelance writer from Princeton, New Jersey. The sources we are using are the book by Andrew Lycett, (Turner Publishing, London, 1995) and The Private Life Of James Bond by David Contosta, Sutter House, Phila Pa, 1993
You can bring down this file by clicking here
In addition, there are several pictures to be added to this document which which can be downloaded as follows
We finish up word today. I will bring in some World War II history books. Let's look at how these are laid out. History books tnd to be years in the making. It is not unusual for an author to spend 3 to 5 years researching what he needs to be historically accurate. And, there is a further need to help those who come after, the researchers who will use this book to create their own tombs.
So, at minimum there is a table of contents and table of index. Neither one have we discussed in class, but you should be aware that these are needed on works of condersideralbe length.
For readability, footnotes and endnotes are available in grat degree. Besides the information they contain, they are used for readability.
Most history books of World War II contain a considerable number of maps and pictures. Table of figures are generaly required sometimes broken up as a table of figure and table of maps.
Research must be thorough for these academic works. Sources, whether other books, papers, articles or discussions must be listed and this requires something like a table of sources.
We'll see this in the books we review this morning
Now, it's on to Excel, the second of the office components we will discuss. Excel. being a spreadsheet, can do almost everything well. It's a tie in to the rectilinear thinking that most of us deal in allows us to use this package to solve many different problems.
Your instructor should discuss the following points with you about excel as we start
We are going to look at a problem that your instructor has previously done in classes. By time we're done, we will have done many of the techniques discussed in the first 3 chapters of the excel portion of your book. But before we start, you must understand that the use of Excel has evolved over the years. The problem we are doing, and the techniques your book describes at the beginning are circa 1985 in its use. Today, excel is used as a supplement to database info (and similar type situations). There is an expectation that raw data is already available in some form (generaly from a database) and that this information will need at minimum subtotaling. Once this is done, Excel's excelent chart (graph) tools finish up the project.
However, for our first problem, we are looking at entering our own data and this data has already been subtotalled. Nevertheless, this problem should give us an idea about entering data and formulas, looking at the normal bias of excel, use of ranges and fills, use of various functions and the use of graphs.
Let's bring up this problem and first discuss it in terms of what you know business to be and to need as far as information is concerned and then we'll start to apply some excel on it. Click here for the Big T auto dealership
Your instructor has decided to make a small change in the way he presents the Big T auto dealership. Using 2 sheets, one designated as old, the other as new, we will parallel the development of this problem by doing it the old fashioned way on the first sheet and using the new table construct on the second sheet. here's how we proceed


Today, we are going to deal with a problem that has a set of line items which we are required to sum for totals. Again ,this problem is not realistic as to the content, but is more like a modern Excel spreadsheet problem that you would find in the real world.
Like the previous problem, there are now several ways to resolve answers. Even more perplexing, these answers involve different mathematical theories and techniques.
Here are the possibilities:
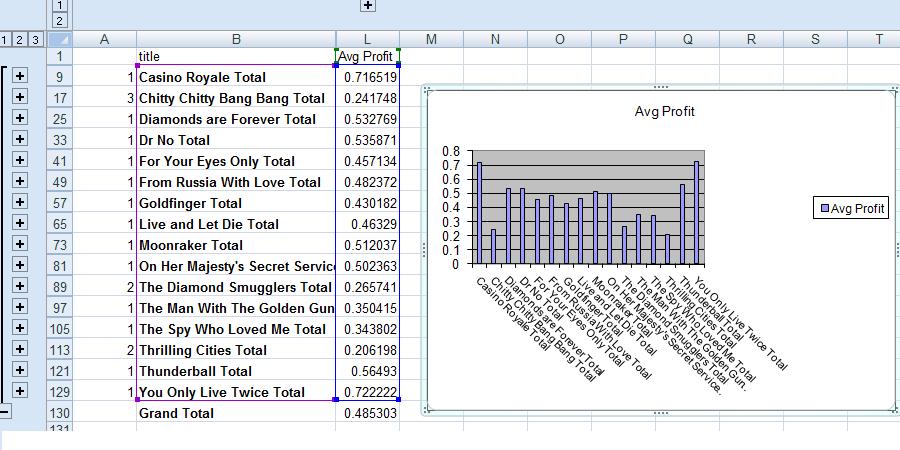
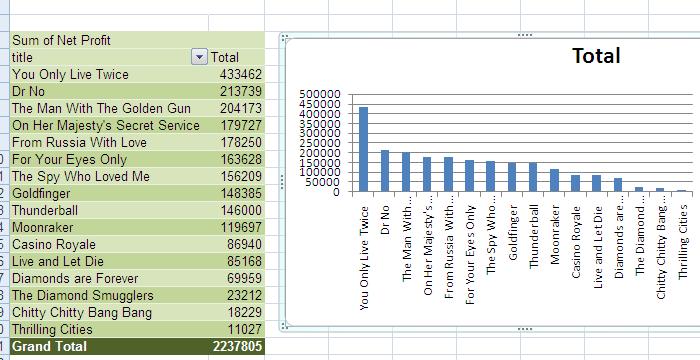
The problem we will start with today is the books of Ian Fleming which you can download by clicking here Note that this is Word document, not tge excel file that you might expect. We will begin our exercise by copying the table info in this Word document to Excel. Move your cursor over the word table. Notice the control on the top right of the table. Click that contorl and all the contents of the table are highlighted. In one way or the other, given all the possibilities of Word, click copy. Move to a new excel spreadsheet and click paste. The data is moved as a table. However, notice that the column length continues to be the default.
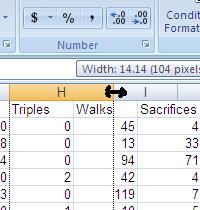
Column length can be done in several ways. The least important is to declare a specific size which you can put in at the format control of the cell group on Home. Easier to do is to grab the demarkation between column designation (A, B,C etc) and separate this physically. The picture on the right gives an example
Another way is to let the system determine column width. This is auto fit. When asked, the system will poll hte entries of each colum keeping track of the entry with the most width in each column. It will then set the column to this width. Therefore, that entry is nestled within the column boundaries and all the others have some space.
Finally, if you need something beyond this for column totals, you can combine width and alignment using format cells. We may give an example of this later in our class
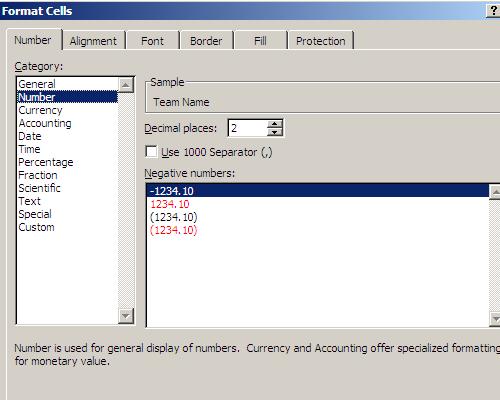
And in speaking of 'format cells', a word on formatting. This is something Excel and all spreadsheets do well but keep in mind it is in context of formating the indvidual cell. Questions arise as to what the data is, the number of decimal points and whether a currency symbol is needed. As to currency, the setup of your operating system determines the default currency symbol and in our case it is the dollar symbol. Below, we see the dialog box used to officially format cells. Generally we are dealing with numbers (currency adds the currency symbol to the number format concepts). In this case, we have selected 2 decimal places and to have negatives show using a minus sign. But, keep in mind that you can use the number group on the home ribbon to accomplish much of the same.
So, having brought in the fleming data into excel, let's set the columns by autofit.Since row 1 is the column header, let's give it some formating - boldness and change in font. From here, let's change the alignment so you can see the possibilities the excel gives you
Once this is done, the question comes in as to how to solve this problem. We have 3 possibilities: subtotals, an independent pivot table and the use of the new table construct that will include the use of a pivot table. To show these, we will make use of the other spreadsheets in our workbook. Let's copy this data to sheet 2 and sheet 3.
Once there, we will resolve sheet1 by subtotal, sheet2 by pivot table and sheet 3 by the new table construct. Your instructor will explain the computation necessary for all these sheets.
Now, we didn't get as far as we would have liked the last time and we still have the Fleming problem to resolve. Your instructor might add that it is ironic that we are continuing this problem because, today, August 12th, 2009, marks the 45th anniversary of the death of Ian Fleming. For your information, and certainly not part of a class in excel, the excesses of smoking 80 high tar cigarettes a day - not to mention imbibing plenty of alcohol - left Fleming in poor health by time he reached his 50's. He had a heart attack in 1961 when he was 52 or 53 and a heart condition prevailed for the rest of his life.
In fact, Fleming was sued for plagiarism (remember we talked about plagiarism in class) in 1961 and spent some time in court defending himself. This was just after his heart attack and he survived his appearence in court by downing a considerable number of nitroglycerin pills, the standard at that time and today to decrease chest pain for those afflicted. Anyway, 45 year ago today, a massive heart attack felled this author. This is over and beyond this course, but if you are interested in the parallel lives of Ian Fleming and James Bond, the Philadelphia ornithologist who Fleming theoretically named his character after, and you are using extended VGA (1200 pixels or more of length), you can get more info in a fake powerpoint presentation by clicking http://www.thediskcoordinator.com/flemingandbond.htm
Anyway, on to our problem. Click here to download the excel spreadsheet as we left it. In doing this, let's get some practice in opening already existing excel spreadsheets. To do this, ask for save to my documents when the FTP program prompts you. Now, as indicated when we discussed Word, you have the choice in loading this file. Go into my documents and click the file and you will have loaded it. Get out of excel and start the process by opening excel up with no file. Click the vista symbol. Ask for open and select this file from my documents. In either case, this file should be accessed.
When we left this on Monday, we had done the subtotals, but we want to do a little more and we had the pivot table and we have a little more to do on that.
As far as subtotals, will sorts work. Remember, you still have to consider the underlying detail info of the spreadsheet. When a subtotal is moved, the underlying data is move with it. What about grand total. Noting in the sort process will keep it from being sorted as data if it is selected. But, Excel will sort only line items selected if that's what you choose. Drag your mouse through the table without selecting grand totals. We can't indicate a column to select by the mouse alone, so we are going to sort the old fashioned way. Click the sort icon. This gives you a table to indicate selection. We are interested in net profit and want largest to smallest. Give the sort dialog box these instructions and you will see the subtotal respond with You Only Live Twice at the top and Thrilling Cities at the bottom. Click 3 on the left to verify that the detail info was moved with the subtotals.
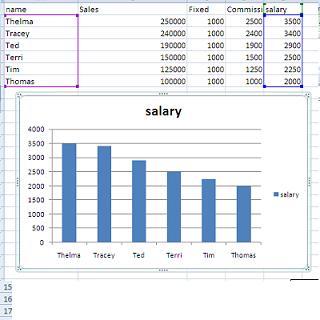
Let's do a graph. But in a smart way. Except for title and net profit, the other columns are superfluous to a graph and perhaps not needed for a presentation. Go up to the column designations and select those columns not needed (B,C,D,E,F,G,H). Use the data ribbon and Group to provide a control to hide and show these columns. Above ht columns you will see numbers and lines. Clicking appropriatedly, you can compress or expand data. With the data compressed, move your mouse cursor through everything you can see except for grand total and insert a bar graph.
Graphs provide a similar problem in the pivot table we created on sheet2. Let's move into this and do a stacked bar graph on this data. A stacked bar allows sections of info to move verically up each bar of th graph. This gives you a graph that can be interprested in two ways, by section and column.
After doing this, we will move to sheet3 and resolve this problem using the new table construct.
Another problem we will do in class is CBL problem. You can see the documentation of this by clicking the next two links: The CBL and cbl06.xls
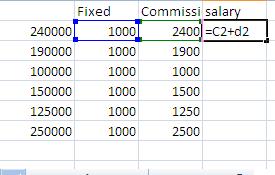
As we do this problem, the most important issue is the calculation of the MVP points. You are being told that these points are calculated by multiplying 4 times the number of homers, 3 times the number of triples, 2 times the number of doubles, the number of singles, three quarters of the walks , 5 of both the steals and sacrifices and each error is at a cost of 3 points. Sum these together to get the ttal of mvp points for each player. These types of calculations should be familiar to students at this level of college regardless of discipline. This is nothing but applied 9th and 11th grade algebra. This is what you studied in high school and it is expected that any college student is proficient in this. If not, supposedly, the school provides for remedial studies of this. This problem and it's calculation is no more difficult than what was done in those classes years ago. And, by the way, good citizenship requires you to be at this level. It is impossible to do things like calculate taxes, handle personal finances, resolve social securitiy and retirement benefits without knowledge which is more difficlt than the resultion of this problem. Anyway, the calculation is 4*e2+3*h2+2*g2+f2+.75*i2+.5*j2+.5*k2-3*l2. The only tricky part here is the -3. Excel will not allow for two mathematical operators to be next to each other. So, putting in +-3* will not work and we can get around this by using -3*.
Whichever we do this problem, subtotals, pivot table or table construct, this is th hard part of the problem. If in subtotals, one would sort to get the teams together in order to do and summations or averages. In Pivot table, we would just insert the pivot table and click the team names and mvp points checkboxes in the pivot table to get our result keeping in mind that the pivot table would assume team names to be string (text or alpha) and therefore placed in the row columns automatically, and assume the mvp points to be numeric and would be placed in the values section defaulting to the summation of the column. So, by default, your pivot table is built. One still has to sort this to determine the winner, and formatting and a graph wouldn't be bad to do. We end up with the following:

Also, below at the bottom of this web page is 2 prior excel tests. After class and before we meet again, you should take a look at the problems that compose these test. On Monday, Aug 17th, we will finish our discussion of excel by finalizing the problemsthat we are doing otday, look some more at several excel functions and go a little more in depth as far as series is concerned.
Today we want to finish up excel if we can. And, if possible, show you what some of the discussions on health care are about. The medical industry is somewhat behind the rest of society in its use of information systems and, besides what going on in town meetings across the country, there is a push to use computer technology in a better way throughout the medical industry to cut costs. This includes payment operations, medical testing and procedures, patient analysis, control and feedback. In the next problem, we are going to look at a fake analysis of weight loss, but understand that this could be done in a similar manner to propose lifestyle changes.
To start this, let's look at a leading way of determinig weight status, For this we will use the body mass index formula 703*weight in lbs/(heigh in inches)^2. The ^2 designates a power operation, in this case a square.
We can try this through excel just to get a feel for it. Let's do you instructor first and then yourself. You instructor probably weight 161 lbs this morning assuming he went ancing last night (he is writing this as of Sunday morning). use =703*161/(68)^2. A score above 30 is obese. A score between 25 and 30 is overweight. 20-25 is normal. Below 20 is underweight. Supposedly, below 18 is an eating disorder. Try yourself.
Beyond the medical info that you have just done, we do have an excel spreadsheet to resolve. So, let's bring up the excel file, bmi on web.xls
This purports to be a study on the weight losses of 162 subjects who had their choice in weight reduction strategy. As in all Excel problems, you must at the data and decide how to attack this keeping in mind the overlying iea behind the spreadsheet. In this case, the authors of this study want to determine the average loss of BMI though each of the regimens. To do so, we need to calculate the difference in BMI per subject
Let's work on the first subject. Using Columns G,H and I, we want to create new statistics of before BMi, after BMI and the difference between before and after. If would seem the the table construct woud work well given that this information would be applied to a pivot table to determine the average loss by regimen. To that end, let's insert a table that includes 3 more columns to work with.
Once this is done, calculate before weight BMI using the formula you worked with above. In the next column, calculate weight after BMI. The final calculation is to determine the difference.
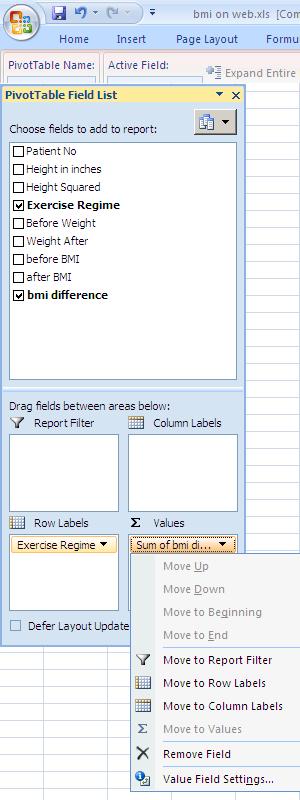
We need to calculate the average loss by MBI for each of the regimens. Average is the key word. Let's invoke a pivot table. We've done this before! This time use exercise regime as row labels and bmi difference as values. But, the value are being summed. Without knowing the number of patients, sum doesn't give us the info we would like. We need average. And in doing average, it is clear that we will also beed to round. In this case, 4 decimal places may be what's needed.
In the values box, click the sum of bmi difference indicator and choose value field seetings as indicated to the right. This will allow to deal with both problems-statistic and rounding.
Immediately, you will be gven a choice as to what statistic to use. You can see there are planty to choose from and we should select average. You should be aware, that the medical profession uses a lot of statisitical analysis and one should not be surprised if a decision was made to look at std dev, for instance. We are not going to use another feature which is quite powerful, Show values as, but if you click to this you will see possibilities such as % of, running total in, etc, which can be quite useful at selected times. We will continue to show this as normal.
We will change the decimal points being shown Click number format and you see the normal format dialog box for numbers. This time select 4.
Let's sort the field to show the best regimen first, the worst last and create a chart. Your instructor did talk about the inability of using subtotals in pivot tables. In this he was talking about the grand schemes of excel usage. You should understand that there is a small set of controls that act somewhat like subtotals in pivot. Under design to the lft you have a few controls to manipulate whather totals should be shown or not. Let's play with this a little bit. Click grand total and turn this off for rows and columns. Notice the last line disapperas. Under more advanced pvot tables (the 3-D your instructor mentioned in class) these controls would even be more obvious. Anyway, below is what we have.

Let's end our study of Excel in a discussion of its use for financial analysis. To do financila analysis right, one must have a feel for capital and how capital accumulates. Let's assume you have a dollar in your pocket for a month. After a month you still have that dollar but you could have invested that dollar for the month and would now have something that is higher than a dollor. This is called opportunity cost and with this opportunity cost comes risk. The dollar in your pocket was readily available to you while your invested dollar was not available and there was a small probability that the entity that borrowed that dollar would refuse or be unable to pay it back when it was due. In a nut shell, you are dealing with finance. The higher the risk, the more in interest you want as a reward. The lower the risk, the less reward you will accept. Even time periods come into play as short term loans have inherently less risk than long term loans.
In the financial industry, the assumption is of a constant rate of interest applied over periods. Let's assume rate i. we would expect to earn 1+i after 1 period. The 1+i accumulates in a like manner, so we would expect (1+i)^2 at the end of the second period and so forth. After 12 periods (this could be a year), this would be (1+i)^12 (or (1+i)^11 if in arrears). After 360 periods this is (1+i)^360 (or 359 depending on the definition). You now know the basis of the mortgage on your house.
In addition, financial investors keep track of something called the rule of 72 (which in actuality is the rule of 69.3 if you study this) which purports to give you a doubling of your prinipal in a certain number of years by dividing the interest rate by 72. As an example, we would expect an investment to double in 12 years if it was given a constant rate of 6% growth. oOn the opposite end, quick analysis would tell us the an invesment will double in 8 years at a 9% rate of return.
Let's use excel to test a question you may have. On August 26th, 1987, the market made a high for that year of 2722 on the Dow Jones index. Now, we don't know what aug 26th, 2009 will bring, but let's use an approximation of 9200. What rate of growth could we expect to calculate for this growth. Let's ballpark it. It should be obvious that the growth has more thsan tippled and is less than 4 times. Let's use 4 times as our measure recognizing that we are going to be high as to the interest rate calculated. So, by our calculation, in 22 years the market went up by 4. This means, the market doubled in 11 years. Now, divide 72/11 and you will see that this is about 6.5%. That's tops. It is lower than that. Let's prove. Take an new excel sreadsheet. Put in 2722 in A1. Now, put in a1*(1+5%) in A2. Copy this down through A22. This is what the market would be if it made a 5% rate of return over the last 22 years. Try 5.5% and copy down. By trial and error, you will find something in the range of 5.97% will do the trick. Besides a financial lesson, this should teach you an excel lesson as well. It is not fun to change and copy down each time. Could we do this more efficiently.
Put a 5% in b1. Set A2 as A1*(1+$b$1) and copy down. Notice, every formula look like the previous cell multiplied by 1+$b$1. The dollar signs indicate absolute addressing. Now, put in 6% in B1. As you register, notice the changes. You can now use trial and error to hone into the rate in an easier manner.
As we study Facebook. one must ask oneself why Facebook has evolved somewhat late in the history of the Internet. FYI, The internet stretches back to 1967 when a group of scientists did the first network packet interchange (using discrete network packets) between Washington and Boston. This technology has a set of names associated with it but the most common usage is TCP/IP. Almost assuredly, your computer at home is set to this for interaction with whoever is supplying you with internet service.
Everything in TCP/IP is set to be decentralized. Starting with 4 numbers, a.b.c.d where all are between 0 and 255 (with some exceptions) the internet has been built up through the years.
In 1989, Tim Bernards Lee, a scientist at CERN in europe, writes a paper detailing how the internet could be more productive if a 'programming' language was uniformly adopted. This language, designated as HTML, was the basis of the first internet browser in 1993, originally names Mozilla and then commercially as NetScape. Why not a social network like facebook at that point?
Even today, internet presentations are broken down between server and client - your computer at home and at the school is a client. Pages, until recently, had to be refreshed at the server level. With low speed access (and even high speed) this is a relatively long process and provides flicker on your screen that is very noticeable.
Several technologies have le to improvements in this. One is broadband, high speed transmission. This is easy to get used to and very noticeable when taken away as your instructor can attest to for the last few days. This speed stops flicker (and page painting) to some degree. Whereas perhaps five years ago maybe 15 to 20% of the web users had such service, today it is very prominent with FIOS and Comcast being in the lead in this area in providing such (not to mention DSL service through your phone line).
But another technology comes into play. HTML has been augmented by various technologies built on top of it on both the server and client side. On the client, which we are interested in, Javascript and it's sister technology, AJAX, allow for real time movement of data with the flexibility to update only part of the screen. Javascript dates back to 1995 and was originally called Livewire. It is a technology that is based inside your browser and each rendition of browsers extends its capabilities. AJAX allows for movement from server to client of data without the need of refreshing screens. One other piece of the puzzle is necessary for this and it comes in the forms of CSS, a major upgrade to HTML and incorporated with HTML. Using the Div element with the ability to position and hide, allows a programmer to chnage only a section of your screen at any moment.
This technology - especially of AJAX -was originated by Microsoft, but used extensively by Google. Facebook has done the same. We can see an example at your instructor's other web site, www.thediskcoordinator.com, where we will look at a set of coding using AJAX, javascript and Div to provide an index to a pseudo database. Although one bug still exists, we should be able to see this technology at work.
We start the last week of our class discussing some of the things that Carol alluded to in her lecture. And, I hope you all agree, that it was an excellent lecture, as have been all the lectures that the librarians have done in my class. But, before we get to that, the take home final is done and ready for you. Click on this link to bring down this test. It is 3 excel problems and you are being told how to do them. The first is by the new construct table, the second is by pivot table and subtotals (do not put this into the new construct, and the third is your choice as long as you can do pivot table analysis.
Now, as to today's lecture. We want ot discuss some aspects of the Internet as far as the coding of web pages are concerned. You set up a "template" in HTML and more advanced sites add to this by use of
And your instructor, who is not an expert, has missed quite a few other technologies. The important part is that web development breakes down between client and server. If using the server, pages are replaced and sent back to the client (user). If using the client, pages are modified on the client screen and pages are not resent. There is an argument as to which is better. Full control would mean the server has control of it all. Less control, and the client has control. Questions also abound as to which is quicker and more efficent. You will have to do your own research to resolve in your mind which is better. Your instructor can tell you that Javascript development is more flexible and for visual basic programmers (or programmers of any object oriented language), Javascript is easier ot get into. You can see and download a javascript enhanced HTML web page by clicking here
How does this web page work? At the top are descriptions as to what Internet standard this page is dealing with. You can see the process that is dealt with. The page is broken up into elements which start with < and end with >. Theoretically, every element must have an ending element so you start to see pairs such as the p element ( bracket p end bracket) and the /p element (bracket /p end bracket). Within the head element is the script element where programming language insructions can be set. You can see quite a bit of coding roken into what is terms in programming as functons. Javascript only supports functions and not the more defined hierarchy of subroutines and functions of higher level languages. In a nutshell, functons are supposed to return value and subroutines not, but in Javascript, it doesn't matter.
Javascript is a interpretive language so therefore it has no debugging tools assigned to it and tends to be slow. It makes up for this slowness by great flexibility. You call in Javascipt functions by other Javascript functions or by extensions to HTML. Where is the HTML> move further down the programs and you will see the ending elemeents for script and then for head. Immedately after, you will see the body element. This is where the HTML elements reside. The first element, Body, has a property, onload, executed when body is ready to show it's stuff. The onload instruction is to execute (run) the startrequest function.
Startrequest itself is of interest to look at. It's code is to invoke AJAX (asynchronous Java Script and XML), a technology created in the late '90's and perfected in the early 2000's which allow the programmer to access data off of a web site without reloading a page. It is this technology - wih one change in HTML - which has given Google and Facebook there modern look as only portions of a page need to be updated. The changes in HTML are called CSS and you can see this in the div startments embedded in the HTML code. Besides DIV and its sister expression span, each HTML element has been upgraded with the style property which allows for an increased flexibility.
By the way, no matter what technology the web master and developer uses, questions abound as to browser (IE, Firefox, safari, Chrome, etc) compatibility. For most web designers this is a continual headache.
We are going to take a look at 2 web sites that deal with an interest of your instructor, Israeli dancing. Your instructor will try to explain this type of dancing to you and if you are lucky, he will not show you any of it in a demo given his lack of expertice. But, when we combine programming with dancing, he is much more sure-footed. One site is www.thediskcoordinator.com which has been mentioned before in this class as to use of technology. This is a site using Javascript and we will look at it's flexibility. The other is www.israelidances.com written in some server side technology. How do we know this is true. Javascript and client side technologies have the capability of updating part of the screen. Now the server stll thinks that the original page is up and being displayed. When asked to refresh or go back, it starts its process from the point where it ended, and not javascript. In the case of a server-sided display, there is no question. We will prove to you the one of these sites is acting as a client based system while the other is a server based system.
Web pages have a tradition of being stodgy but newer sites, like Facebook demonstrated last Wednesday, are changing this look. We will use the discoordinator website to show you the use of randomness in the creation of websites.
Once you have a web site, the next question is who is looking at it. Obviously dynamic websites - ones that are continually being worked on - have visits by their creators to see if they are displaying and acting as they should. How about the other visitors. You instructor, with the approval of the creator of the diskcoordinator website, believes that he can find the statistics indicating visits to this site. We will take a look at this. Another question: who owns this site and even more important, how do you get a site.
The internet is a set of hierarchial connections. Servers sit on a connection and are owned by some entity. This entity is allowed to provide hosting. They can do this through the 4 digit numbers described above, a.b.c.d where a,b,c and d are number between 0 and 255 with some exceptions. You can get your own 4 digit number by dealing with verisign and several other net providers which control .com,.edu, etc. Verisign uses registrars to register web names. We can look the registrars authorized by verisign at www.verisign.com/domain-name-services/find-registrar/index.html. Look at the name Tucows as we will be seeing it again.
To find info on www.thediskcooridnator.com, your instructor wil use some info given to him and you will have to look at the screen to see what is going on. We are going into the web usage (hits and visits) for this web site. YOu will notice that 2 months can be indicated and we will look at the present month, August.
Alright, what do we have. Data indicating total hits with additional info of total pages and total files. A page would be something that displays a web page. Files would be the underlying transfer of information. The system knows this because it must provide this inforamtion for web-caching, a process that speeds up your internet usage. All pages are cached by your browser when it talks to this server. The cached files and pages are what's being counted here. Let's look down further. You can see who (as a web URL) has inquired abount the diskcoordinator.com. Some of these should be familiar such as comcast, verizon and Fios. Oters are obviously from schools such as Rutgers, NYU. No doubt we could track Community which uses a third party to get onto the internet. Of interest is the google, aol and msn hits. These are search engine spiders trying to decipher this web site
Finally, who owns this site. Well, let's see if we can find out. Enter www.whois,sc and you will be redirected to a page that allows you to cross reference this site. Type www.thediskcoordinator.com. Voicenet as well as TUCOWS will show up as will the owner of this web site. Even though the owner has not identified himself on his own website, Voicenet is required by TUCOWS to provide a legitimate ID. The web page indicated by Carol might (or might not) have the same situation depending on how Villamova is hooked up to the web.
Assuming that your instructor has not forgotten, he hopes to have taken his digital coamera with him today. Digital cameras, like all cameras, are a mass of optical technology beyond the scope of this class and your instructor. However, they also are a mass of computer technology. At minimum, a digital camera is a flash memory device and your instructor's Olympus E420 is no exception. Note, though, like all companies today, Olympus makes money selling periferal equipment including it's version of the USB cable necessary for go from the camera to the computer, so don't lose this cord or it becomes even more expensive. Anyway, Once pictures are taken, and the camera is hooked up to the computer, downloading is similar to using any other usb device.
The industry standard today is what's known as the JPEG format (jpg as an extention in Windows). This is not the only format for graphics. When WIndows started, Microsoft used a pcx format, later enhanced to BMP. These formats, native to Windows, are still supported in the WIndows operating system. The Internet graphic capability developed independently of any operating system criteria and the graphic of record through the early 90's was GIF. GIF, which is still supported and still has a considerable presence on the web, has superlative visual features but is very long in length. In the early 1990's, JPG was introduced. It is not a visually acute as GIF but is can be quite small in its footprint which maks it the defacto standard on the web. Other graphic formats include TIFF, which is the electronic equivalent for fax files and png (sometime Pnp), a graphic format brought out to enhance JPEG but which has never become popular.
Let's use these pictures for two projects today: an HTML page and a powerpoint project. We will not use Javascript a this point constraining ourselves to HTML. Your instructor will attempt to update your machine with these pictures so you can join in the fun.
We don't have to worry about which technology we are using so we can go directly to the first statement, head. We can also use any text editor for this, and Notepad, on your computer will do fine. Set up this element with an immediate ending head and do a similar situation for body. Now within Body we need p elements and img elements. P elements deal with text and the img element deals with displaying pictures. At this point, it's probably a better idea to show this on the boad which we will do as we attempt to document this class in pictures.
This is being written after the class. We took some pictures and with difficulty, part of which is the setting at the WERC center, came up with some text and a picture in a HTML based file. At the top of this document, there is a link to a traditional HTML codes display of the pictures taken at the center today. Click here for that link.Below is the code. Notice that this follows the traditional HTML format of head and body. Inside the body we are using table to set up the format of the pictures.
<html >
<head>
    <title>Werc on a wercday</title>
</head>
<body>
<a href="index.htm">Back to index.htm</a>
<h1>August 24th, 2009. Pictures taken before and during the class at WERC</h1>
<table  width="100%">
<tr>
<td><img src="werc/werc1.jpg" width="200px" /></td><td><img src="werc/werc2.jpg" width="200px"/></td><td><img src="werc/werc3.jpg" width="200px"/></td><td><img src="werc/werc4.jpg" width="200px"/></td>
</tr>
<tr>
<td><img src="werc/werc5.jpg" width="200px" /></td><td><img src="werc/werc6.jpg" width="200px"/></td><td><img src="werc/werc7.jpg" width="200px"/></td><td><img src="werc/werc8.jpg" width="200px"/></td>
</tr>
<tr>
<td><img src="werc/werc9.jpg" width="200px" /></td><td><img src="werc/werc10.jpg" width="200px"/></td><td><img src="werc/werc11.jpg" width="200px"/></td><td><img src="werc/werc12.jpg" width="200px"/></td>
</tr>
</table>
</body>
</html>
We could if we wanted to, have done this more efficiently in Javascript. In fact, there is no need for body positioning when dealing with pure coding. First, here's the link to a pure Javascript version of this click here. Below is the coding.
<html>
<head>
    <title>Werc on a wercday</title>
<script charset="utf-8" type="text/javascript">
var html = "<h1>August 24th, 2009. Pictures taken before and during the class at WERC</h1><table width='100%'>"
for (var r=1;r<4;r++)
    {
    html = html + "<tr>;"
    var q = 4 * (r-1) + 1;
    for (var r1=q;r1<q+4;r1++)
        {
        html = html + "<td><img src='werc/werc" + r1.toString() +".jpg' width='200px' /></td>;"
        }
    html=html + "</tr>;"
    }

    document.write(html + "</table>")

</script>
</head>

</html>
In running both of these, you are probably going to find the the second runs faster at the onset. Once these have been run as stay on the 777rauer web page, caching comes into play and the pictures are already in your computer's memory or being saved in your computer's temporary storage area. In both case, the pictures have to be passed from the server to the client, your machine. After that, HTML has to be rendered which means that your browser works on the syntax of the HTML statements as it encounters them. In the bottom, this is all processed by Javascript immediately into HTML code.
as indicated above, the excel take home final is ready for you. Click on this link to bring down this test. It is 3 excel problems and you are being told how to do them. The first is by the new construct table, the second is by pivot table and subtotals (do not put this into the new construct), and the third is your choice as long as you can do pivot table analysis.
We end our class looking a powerpoint. Your instructor wants you to keep this in mind: Powerpoint is word without the test. No worries about text wrap, or what is the home position of the document and what is the end. References,table of contents and first page are non existent.
We need dome pictures and the pictures taken last session will do. Let's be smart in getting them. The internet provides a protocol designated as FTP. This protocol is much older than HTTP which we use all the time. Your insturctor has put some files out on direcotories in the 777rauer web site that support anonymous FTP which we are about to use
First, in my documents, create a directory. This is the directory we will put the pictures. Next, type in ftp://www.777.rauer in the internet explorer bar. When the connection is set, it is easier to deal with this using Windows explorer, so set either the tools or pages list to open FTP in Windows explorer as indicated below
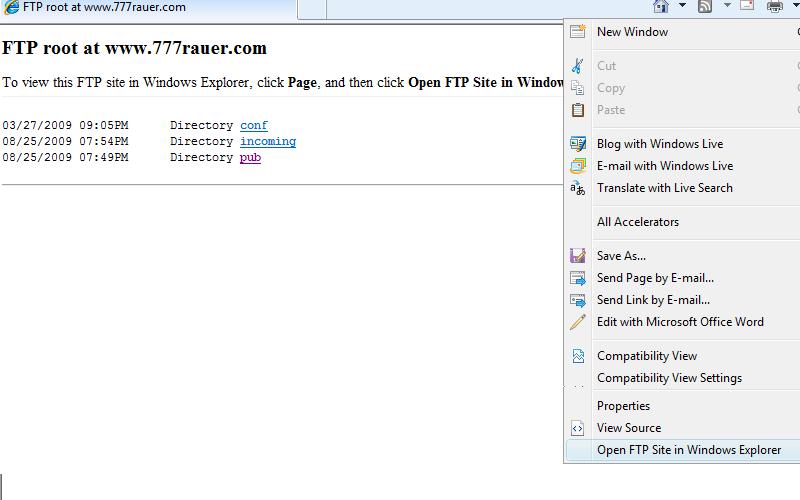
Now, select the files - they are werc1 through werc12 and drag inti the directory you set above. We are aiming to emulate the follwoing powerpoint presentation which you can bring down and see
Today's powerpoint presentation will look like this. With the pictures downloaded to your machine, we can try to copy the look of this powerpoint presentation keeping in mind that you should be more artisitic in the end than your instructor and thus, you should try this again on your own.
Let's open Powerpoint. The default of powerpoint is the two textboxes that you should see. Although it is not critical given the ability to add multiple objects through the insert ribbon tab, if you click your right button on the slide as it is indicated to the right, you could change the layout of this slide (Powerpoint uses the term slide for form, page or window). The templates in the middle are of interest. You can see a section that has several icons on it. This "multi" box allows for pictures, text, graphics, smart art, clip art and video placement possibilities. If you would click on any of the templates in new slide, it would change on the screen, but for our purposes we can use what was defaulted. This opportunity for different templates exists also when inserting a slide. If you click the new slide button on the home ribbon tab, you will see the same options. In this case, however, clicking on a template adds a new slide to your document.
We have two lines that start our presentation. Let's fill them in one at a time. Start with the top and type in "Communitiy College Of Phila." as a title. Add "A look behind WERC" as a subtitle. It should be no surprise to you that you can change font, point size, justification, bolding, underlining and color to these pieces of text just as we did in MS Word. All the characteristics of text modification exist as they do in Word except for the fact that you are dealing with textboxes and not the entire page.
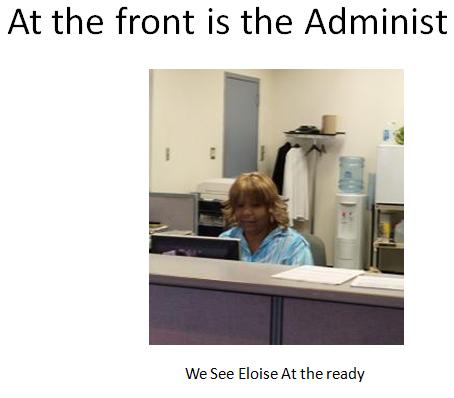
Now, onto the second slide. We have text above and below a picture. There is not an exact template for this, but we can use the title and content template for our purposes. Let's work on title first: 'Enter At the front is the Administration' in the top text box. The next box is this type of multi box mentioned above. This alows for easy inclusion of pictures, creation of graphs, use of smart art (which we will not do today but you should look at on your own), creation of tables, insertion of clip art which you have seen in MS Word and the insertion of a video. Let's insert a picture by clicking the picture icon and locating and inserting werc1.jpg. Some manipulation of size is needed here and you can manipulate the handles of the picture to accomplish this.
We need another textbox for the text below the picture. Use the insert ribbon tab to locate textbox exactly as done with word. Use this to insert and manipulate the text box entry below the picture. In the end, this slide should look something like what's indicated to the right
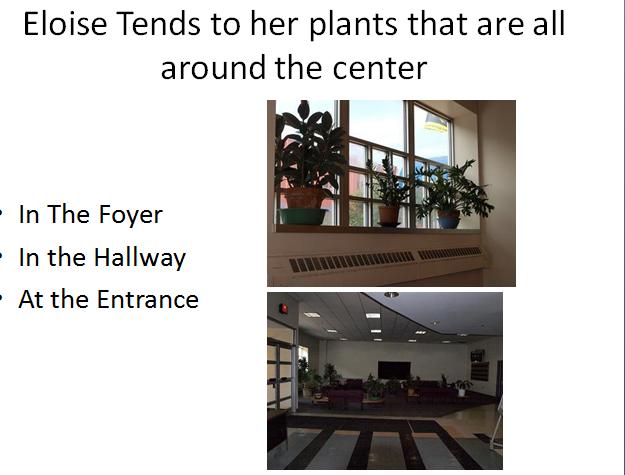
We next attack slide 3. A title at the top, bulleted items at the left, 2 pictures to the right. The multi box will automatically bullet text when text is inserted into it - you can turn it off if you want. Therefore, creating a new slide, the closest we can get is the two comparison template. Let's fill in the title 'Eloise Tends to her plants that are all around the center' and start to look at the left hand multi box.
We have 3 bulleted action items. As you type these in, the bullets are automatically set. You can change the bullet style as you did in MS Word or change to numbering. Obviously, you can also un bullet text if you want. Enter the 3 bulleted phrases.
Set in the first picture. This is werc4.jpg. manipulate the size and location allowing room for the next picture. Now, use the insert ribbon tab to insert werc3.jpg into the slide. Again, use the handles to manipulate the picture so that it lines up accordingly. When you are done, you should have what is displayed below.
In essence, the next slide is the same as the slide we just worked on, except that the pictures move horizontally as opposed to vertically. It is exactly the same procedure as above except for manipulating the pictures to the bottom as opposed to the side. This takes to the last picture. Your instructor, for whatever reason, likes to do a montage with at least one slide in a show. This last picture is it. Create a new slide, but this time set it to blank since no template really meets out needs. Use the insert ribbon tab to insert the remaining pictures. Just put them on and we'll arrange them. We need some text at the top. Use hte insert ribbo tab to insert a text box. Enter the text 'and finally our cis103 class'. Now, start to arrange the pictures as a pinwheel (around the horn so to speak). After a while, you should get a slide that looks similar to what is the last slide in our powerpoint presentation.
Once you have your slides, it;s very easy to run. Click slide show and begin then from beginning. Many options exist for the running of powerpoint including ties in to music, timing, transition and the like. As usual, it is your creativity that bring out the best in powerpoint. Click this link to see a good example
I have put on this web site an older tutorial used to discuss fonts and to allow a student to understand the beginning aspects of MS Word. You can find the files to download by clicking here
In addition, a ms word document can serve as a tutorial for cutting and pasting. This also talks a little about the clipboard on your system. You can download this by clicking here.
Finally, I have included an older tutorial discussing styles. Now, this is in the 2003 version and this version, 2007, makes it much easier to deal with, but you could read this tutorial to get an overview of concept of style. You can bring this down by clicking here.
Word has tables. Your instructor has created a word document that provides some exercises in creating ad working with tables. You can load this word file by clicking here
This is an invitation to attend the Community College Of Philadephia’s Institute Of Historical Awareness lecture on the battle of Midway. You were a principle to this battle and we hope that your input will provide more insight into the following discussions:
The following participants in the battle are slated to attend
| Participant | Lecture | |
|---|---|---|
| Chuichi Nagumo | Commander of Japanese Fleet | How Indecision In Battle Can Be Costly |
| Raymond Spruance | Commander of Us Fleet | How To Be Up For Challenges. |
| Franklin Roosevelt | Us President at the time | Moral Boosters In Times Of Conflict |
As you can see there should be a wide ranging discussion about this battle and we look forward to your attendance
A project done last term could be used for additional practice for the Week 5 in-class dicussion. Load this link